| Model type | Examples | Purpose |
|---|---|---|
| Weather (global) | GFS, ECMWF, ICON, ARPEGE | Broad-scale ocean basin forecasting |
| Ensemble forecasts | GEFS, ECMWF-EPS | Probability range across model runs |
| Weather (regional) | NAM, WRF, HRRR | High-resolution coastal/regional detail |
| Hurricane / tropical | HWRF, HMON, HAFS, ensemble tracks | Storm track and intensity forecasting |
| Wave & Swell | WaveWatch III, GWAM, EWAM | Sea state and swell forecasting |
| Ocean current | RTOFS, HYCOM | Ocean current prediction |
Our forecasts, departure and routing recommendations are built using your specific vessel design and performance parameters, high-resolution, long-range global and regional computer models, high-resolution satellite and radar imagery, global and regional synoptic forecasts, and detailed weather, plotting, and routing software. Here is an overview of the many weather and routing resources we use.
Vessel & voyage data
Every route starts with your yacht, not the weather. We factor in:
- Vessel type — motor yacht (MY) or sailing yacht (SY)
- Sub-type (MY) — trawler, sportfish, catamaran, mega yacht
- Sub-type (SY) — displacement or planing, sloop, ketch, schooner, multi-mast
- Length, beam, and draft
- Displacement
- Fuel capacity, cruising speed(s), and fuel burn rate
- Range under power
- Speed under sail (SY) — target/polar speeds
- Sail inventory & VPP (SY) — Velocity Prediction Program data file, if available
- Departure point, destination, and preferred timing
Computer models
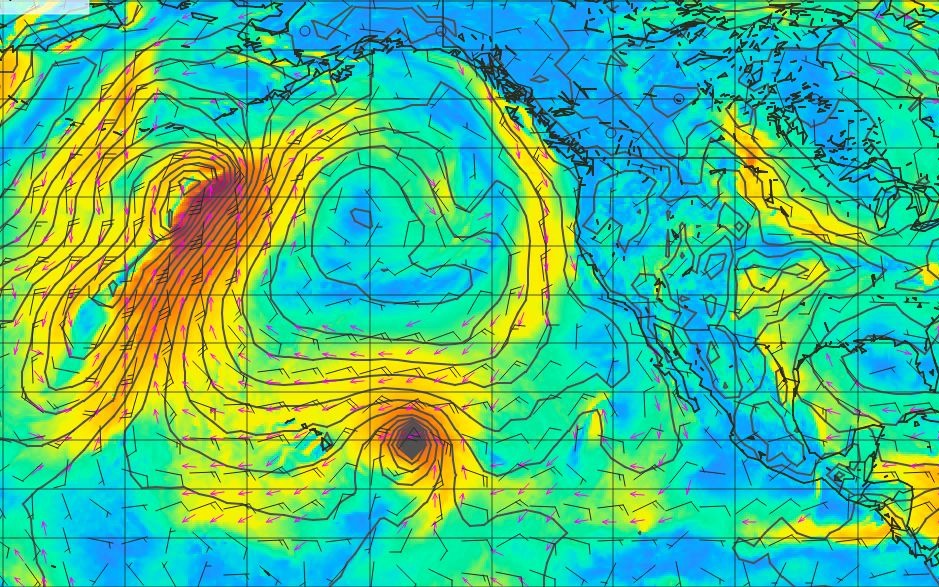
GFS surface analysis — NE Pacific
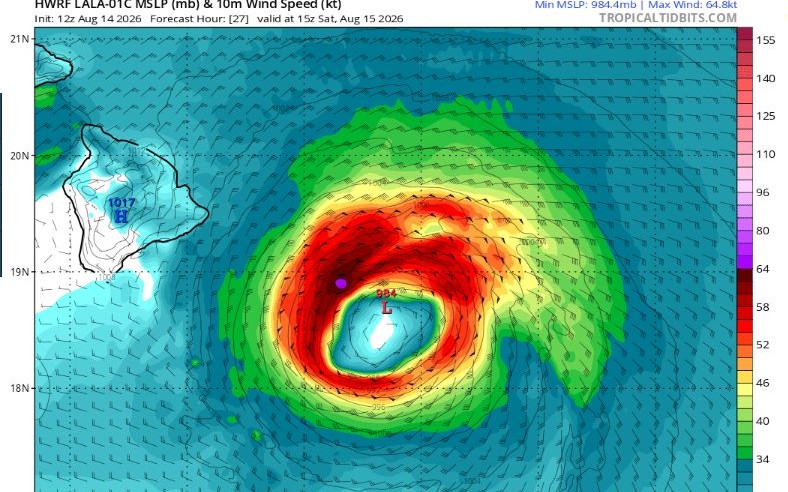
Hurricane track & intensity forecast — HWRF model, Hurricane Lala approaching Hawaii
Satellite & radar imagery
Satellite imagery — geostationary coverage across all major ocean basins:
- GOES-East / GOES-West (NOAA) — Americas, Atlantic, Pacific
- Himawari-9 (Japan) — western Pacific, Asia-Oceania
- Meteosat (EUMETSAT) — Europe, Africa, Atlantic, Indian Ocean
- GEO-KOMPSAT, FY-4, INSAT — regional coverage for NE Asia, China, and the Indian Ocean
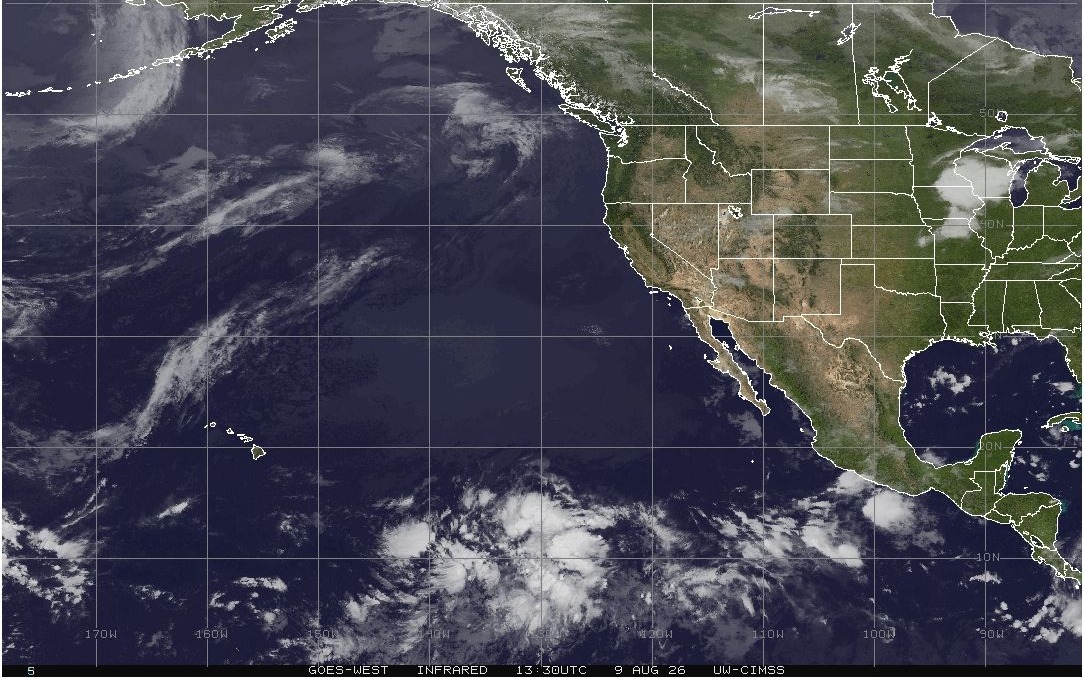
GOES-West infrared — NE Pacific
Radar imagery — ground-based, generally limited to 150–250nm from the coast:
- NEXRAD (US) — Atlantic and Gulf coasts
- OPERA (Europe) — 30+ countries
- National networks (Canada, Japan, Australia) — regional coastal coverage
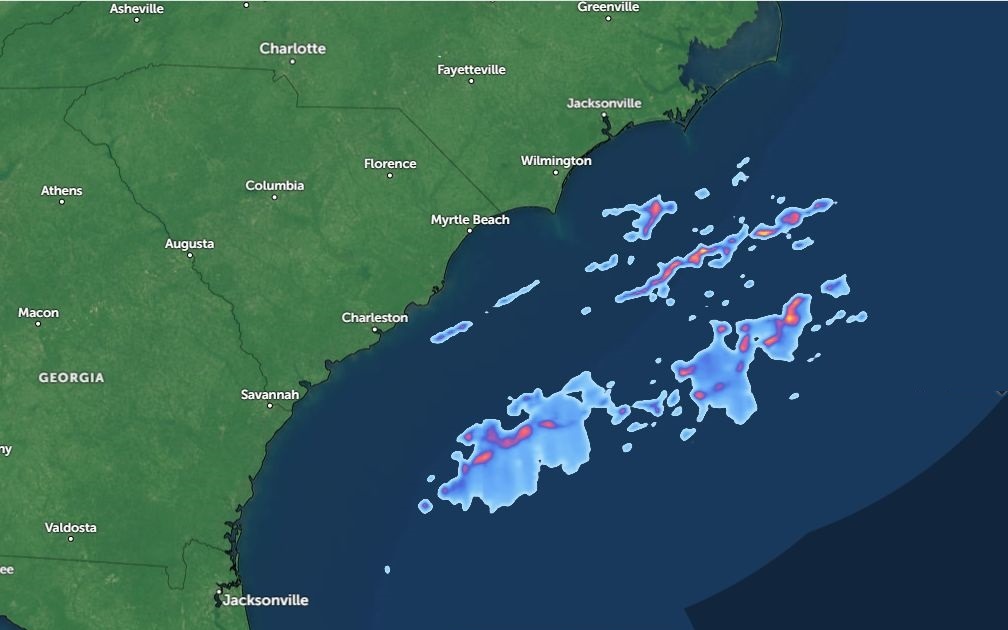
NEXRAD coastal radar — US Mid-Atlantic
Observation & reference data
High seas forecasts — forecaster-authored bulletins (WMO/IMO GMDSS):
- 21 METAREAs worldwide, each with a designated issuing service
- NWS Ocean Prediction Center — METAREA IV and XII
- Météo-France, Greece, UK Met Office, MetService NZ — Atlantic, Mediterranean, Pacific
- Written by duty forecasters, not derived from model fields — used to cross-check the weather models and our forecasting & routing recommendations.
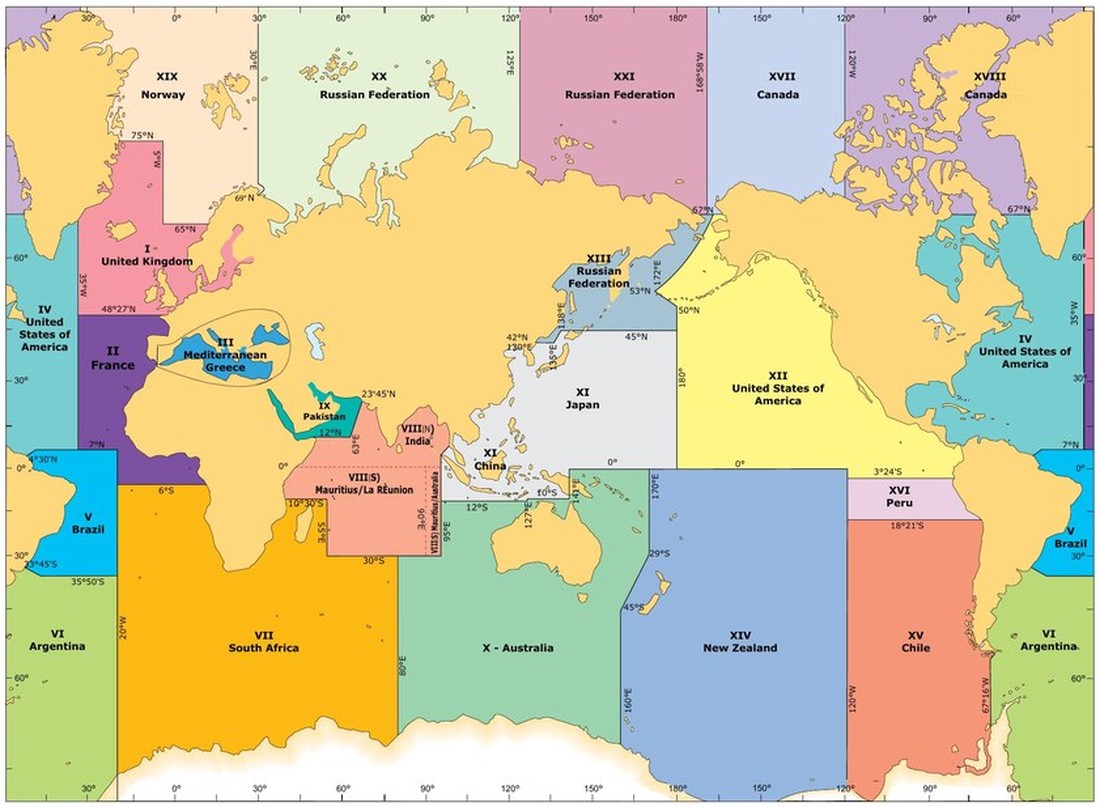
METAREA limits — WMO No. 9, Vol. D
- Global synoptic weather charts — Ocean Prediction Center's meteorologist-analyzed surface charts showing fronts, pressure centers, and gale and storm warning areas.
- Buoy and ship observations — real-time conditions used to verify and adjust model output
- Tide and current tables
- Navigational warnings and Notices to Mariners
- Pilot charts and climatology — historical seasonal averages
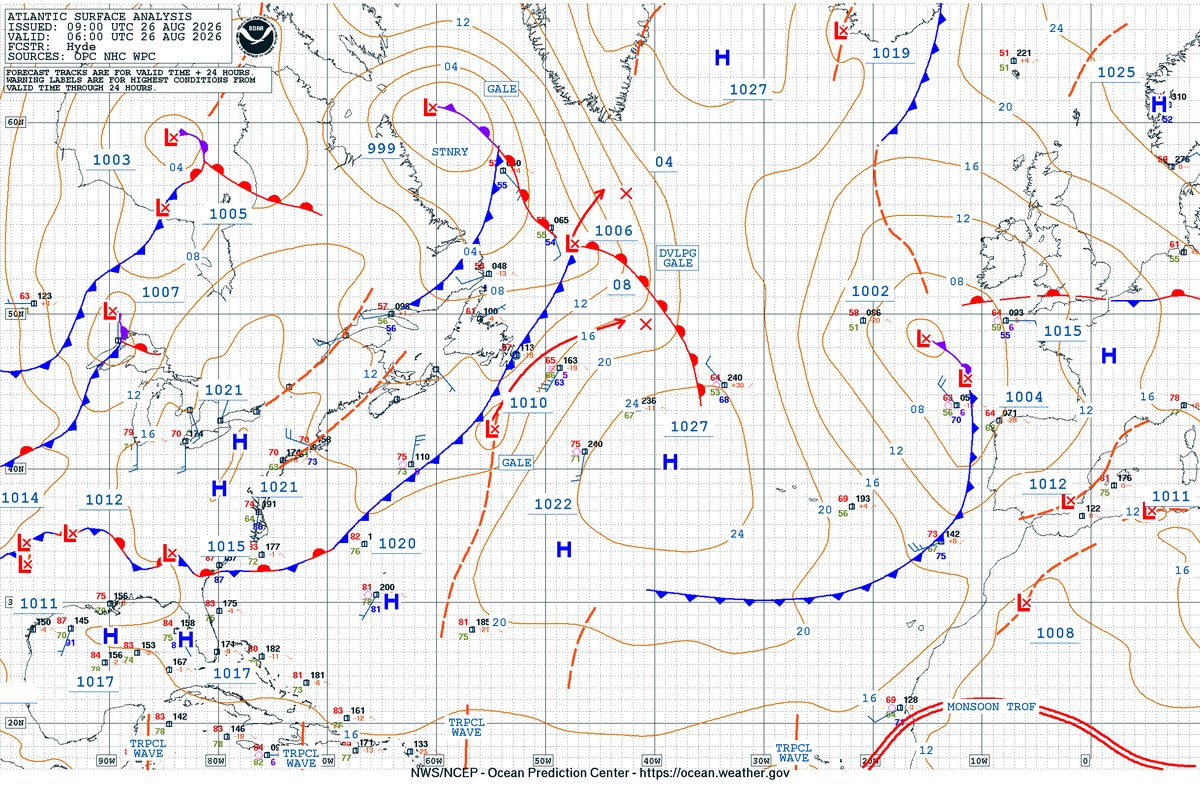
Surface analysis — North Atlantic, NWS/NCEP Ocean Prediction Center
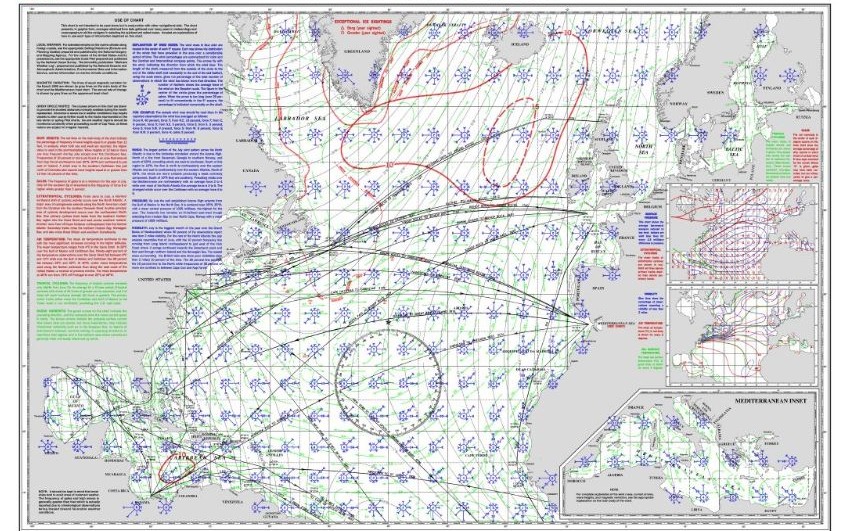
Pilot chart — North Atlantic, July
Weather & routing methods and software
Isochrone route optimization steps a passage forward hour by hour, testing each candidate heading against the vessel's own velocity prediction program (VPP) polar data at the forecast wind and sea state — which is what makes a route vessel-specific. The software we use to build and test candidate routes:
- PredictWind — GRIB forecasts, offshore routing, and weather app popular with cruisers and racers
- Squid — weather routing and GRIB app geared toward offshore sailors
- Expedition — professional navigation and routing software widely used in ocean racing
- TimeZero — chartplotting and navigation software with integrated weather routing
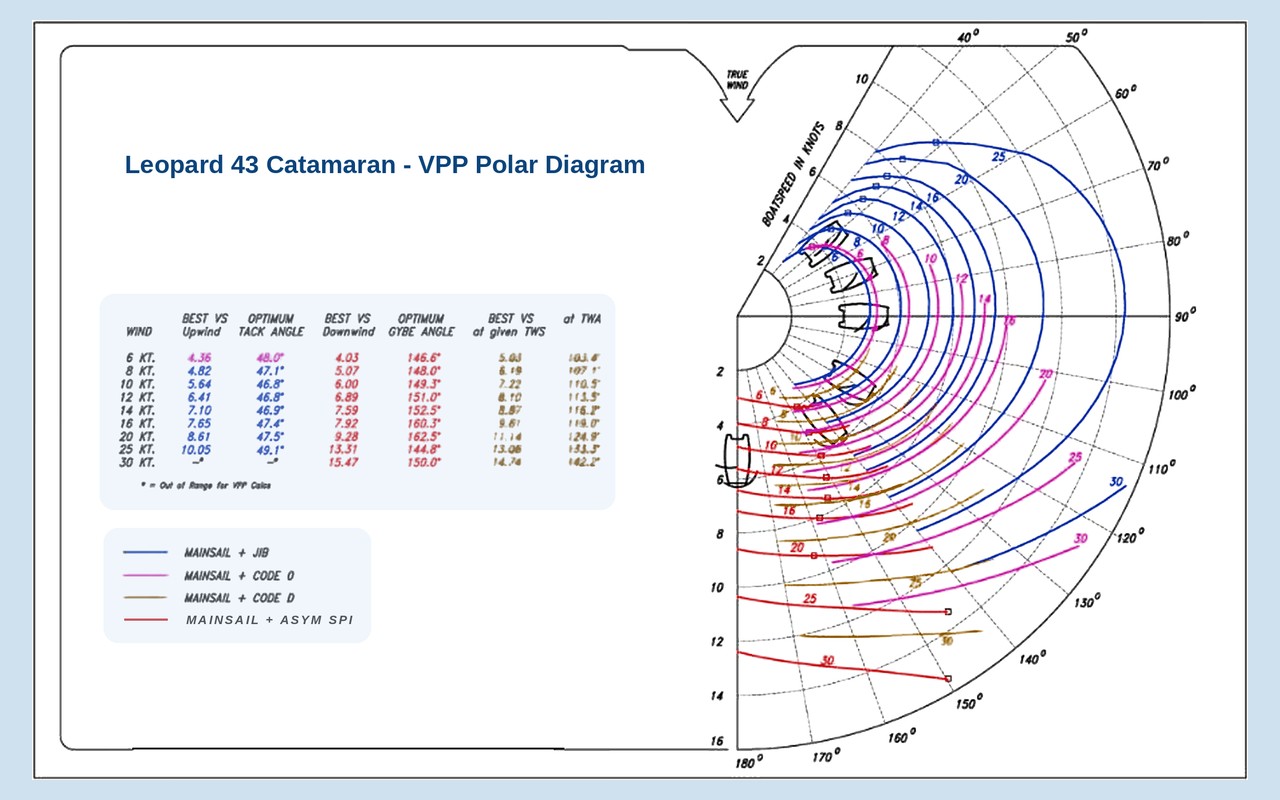
Sample VPP polar diagram — Leopard 43 catamaran
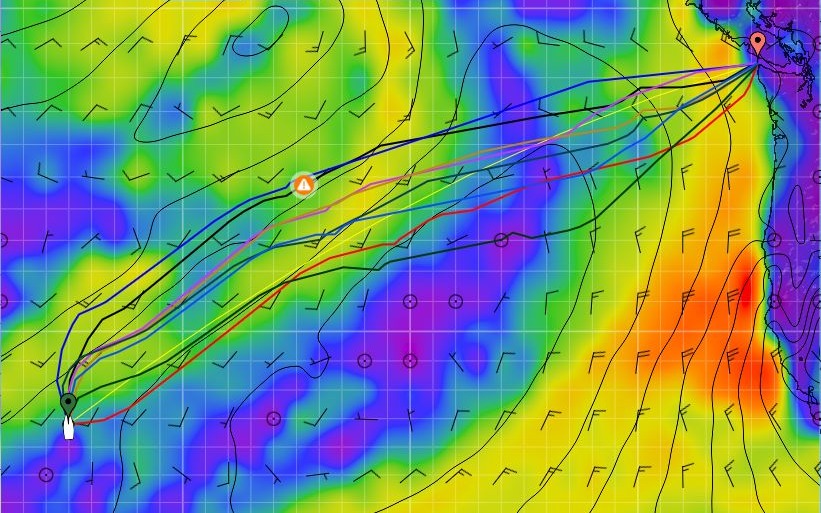
PredictWind routing output
AI-enhanced forecasting
The most recent addition to our forecasting, routing, and passage-timing toolkit is AI. By combining historical and current model data, current satellite data, and each vessel's own performance (VPP) data, AI lets us cross-check and refine the computer models above — resulting in significantly enhanced forecast accuracy, extended reliable forecast periods, and safer passages.
Forecast range & accuracy
- Global weather models — forecasts extend out to 7–10 days
- High-resolution regional and mesoscale models — forecasts extend out to 2–5 days
- Accuracy decreases steadily with forecast interval — roughly 5% per day. A 5-day forecast is about 75% accurate; a 10-day forecast is about 50% accurate